• For Individuals
  • For Businesses
  • For Universities
  • For Governments
Coursera
Log In
Join for Free
Coursera
  • Browse
  • Pivot Table

Pivot Table Courses Online

Learn pivot table techniques for data analysis in Excel. Understand how to organize, summarize, and visualize data using pivot tables.

Skip to search results

Filter by

Subject
Required
 *

Language
Required
 *

The language used throughout the course, in both instruction and assessments.

Learning Product
Required
 *

Build job-relevant skills in under 2 hours with hands-on tutorials.
Learn from top instructors with graded assignments, videos, and discussion forums.
Learn a new tool or skill in an interactive, hands-on environment.
Get in-depth knowledge of a subject by completing a series of courses and projects.
Earn career credentials from industry leaders that demonstrate your expertise.
Earn your Bachelor’s or Master’s degree online for a fraction of the cost of in-person learning.

Level
Required
 *

Duration
Required
 *

Skills
Required
 *

Subtitles
Required
 *

Educator
Required
 *

Explore the Pivot Table Course Catalog

  • Status: Free Trial
    Free Trial
    I

    IBM

    Excel Basics for Data Analysis

    Skills you'll gain: Excel Formulas, Microsoft Excel, Data Cleansing, Data Analysis, Data Import/Export, Spreadsheet Software, Data Wrangling, Data Quality, Pivot Tables And Charts, Google Sheets, Data Manipulation, Data Science, Data Integrity, Information Privacy

    4.8
    Rating, 4.8 out of 5 stars
    ·
    10K reviews

    Beginner · Course · 1 - 3 Months

  • C

    Coursera Project Network

    Excel for Beginners: Pivot Tables

    Skills you'll gain: Pivot Tables And Charts, Spreadsheet Software, Microsoft Excel, Data Visualization Software, Google Sheets

    4.6
    Rating, 4.6 out of 5 stars
    ·
    162 reviews

    Beginner · Guided Project · Less Than 2 Hours

  • C

    Coursera Project Network

    Introduction to Data Analysis using Microsoft Excel

    Skills you'll gain: Microsoft Excel, Excel Formulas, Spreadsheet Software, Pivot Tables And Charts, Data Analysis, Data Manipulation, Microsoft Office, Data Mining

    4.7
    Rating, 4.7 out of 5 stars
    ·
    4.3K reviews

    Intermediate · Guided Project · Less Than 2 Hours

  • C

    Coursera Project Network

    Create Charts and Dashboards Using Microsoft Excel

    Skills you'll gain: Dashboard, Microsoft Excel, Microsoft 365, Microsoft Office, Spreadsheet Software, Data Visualization, Trend Analysis, Data Analysis

    4.6
    Rating, 4.6 out of 5 stars
    ·
    985 reviews

    Intermediate · Guided Project · Less Than 2 Hours

  • Status: Free Trial
    Free Trial
    M

    Macquarie University

    Excel Skills for Data Analytics and Visualization

    Skills you'll gain: Pivot Tables And Charts, Data Storytelling, Power BI, Excel Formulas, Data Analysis Expressions (DAX), Data Visualization Software, Data Visualization, Interactive Data Visualization, Microsoft Excel, Dashboard, Data Modeling, Data Cleansing, Data Transformation, Data Manipulation, Excel Macros, Infographics, Spreadsheet Software, Data Analysis Software, Data Validation, Data Analysis

    4.8
    Rating, 4.8 out of 5 stars
    ·
    5.9K reviews

    Intermediate · Specialization · 3 - 6 Months

  • Status: Free Trial
    Free Trial
    C

    Corporate Finance Institute

    Data Skills for Excel Professionals

    Skills you'll gain: Dashboard, Microsoft Excel, Pivot Tables And Charts, Star Schema, Spreadsheet Software, Data Transformation, Data Analysis Expressions (DAX), Data Storytelling, Data Analysis, Excel Formulas, Extract, Transform, Load, Data Visualization Software, Data Presentation, Data Modeling, Business Intelligence, Competitive Analysis, Data Manipulation, Data Cleansing, Data Integration, Data Import/Export

    4.8
    Rating, 4.8 out of 5 stars
    ·
    155 reviews

    Beginner · Specialization · 3 - 6 Months

What brings you to Coursera today?

  • Status: Free Trial
    Free Trial
    C

    Corporate Finance Institute

    Power Pivot Fundamentals

    Skills you'll gain: Dashboard, Star Schema, Pivot Tables And Charts, Data Analysis Expressions (DAX), Data Storytelling, Microsoft Excel, Data Modeling, Business Intelligence, Competitive Analysis, Data Presentation, Interactive Data Visualization, Key Performance Indicators (KPIs), Business Metrics, Data Manipulation

    4.8
    Rating, 4.8 out of 5 stars
    ·
    31 reviews

    Beginner · Course · 1 - 3 Months

  • C

    Coursera Project Network

    Conditional Formatting, Tables and Charts in Microsoft Excel

    Skills you'll gain: Data Literacy, Microsoft Excel, Data Visualization Software, Spreadsheet Software, Pivot Tables And Charts, Exploratory Data Analysis, Data Analysis Software, Data Analysis

    4.7
    Rating, 4.7 out of 5 stars
    ·
    244 reviews

    Intermediate · Guided Project · Less Than 2 Hours

  • Status: Free Trial
    Free Trial
    I

    IBM

    Data Visualization and Dashboards with Excel and Cognos

    Skills you'll gain: Data Storytelling, Data Visualization, Data Visualization Software, Dashboard, IBM Cognos Analytics, Tree Maps, Scatter Plots, Data Analysis, Pivot Tables And Charts, Microsoft Excel, Histogram

    4.7
    Rating, 4.7 out of 5 stars
    ·
    4.3K reviews

    Beginner · Course · 1 - 4 Weeks

  • Status: Free Trial
    Free Trial
    M

    Microsoft

    Microsoft Excel with GenAI

    Skills you'll gain: Excel Macros, Prompt Engineering, Microsoft Excel, Data Cleansing, Excel Formulas, Pivot Tables And Charts, Microsoft Copilot, Dashboard, Forecasting, Data Presentation, Data Storytelling, Data Processing, Data Visualization Software, Data Manipulation, Data Visualization, Workflow Management, Data Wrangling, Data Quality, Statistical Analysis, Data Transformation

    4.3
    Rating, 4.3 out of 5 stars
    ·
    241 reviews

    Beginner · Professional Certificate · 3 - 6 Months

  • Status: Free Trial
    Free Trial
    Status: AI skills
    AI skills
    M

    Microsoft

    Microsoft Business Analyst

    Skills you'll gain: Microsoft Power Platform, Excel Formulas, Process Flow Diagrams, Business Process Modeling, User Story, Business Requirements, Stakeholder Management, Data Modeling, Microsoft Excel, Software Development Life Cycle, Requirements Analysis, Requirements Elicitation, Quality Management, Pivot Tables And Charts, Microsoft Visio, Power BI, Microsoft Power Automate/Flow, Business Analysis, Scrum (Software Development), Data Analysis

    4.6
    Rating, 4.6 out of 5 stars
    ·
    1.3K reviews

    Beginner · Professional Certificate · 3 - 6 Months

  • Status: Free Trial
    Free Trial
    M

    Macquarie University

    Excel Skills for Business

    Skills you'll gain: Microsoft Excel, Dashboard, Excel Formulas, Spreadsheet Software, Data Visualization, Excel Macros, Data Validation, Data Cleansing, Data Analysis Expressions (DAX), Data Modeling, Financial Forecasting, Data Management, Business Intelligence Software, Consolidation, Data Integrity, Data Entry, Business Reporting, Productivity Software, Financial Modeling, Loans

    4.9
    Rating, 4.9 out of 5 stars
    ·
    63K reviews

    Beginner · Specialization · 3 - 6 Months

Pivot Table learners also search

Analytics
Business Intelligence
Business Analytics
Business Intelligence Projects
Digital Analytics
Web Analytics
Financial Analytics
Social Media Analytics
1234…27

In summary, here are 10 of our most popular pivot table courses

  • Excel Basics for Data Analysis: IBM
  • Excel for Beginners: Pivot Tables: Coursera Project Network
  • Introduction to Data Analysis using Microsoft Excel: Coursera Project Network
  • Create Charts and Dashboards Using Microsoft Excel: Coursera Project Network
  • Excel Skills for Data Analytics and Visualization: Macquarie University
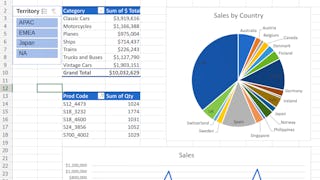
  • Data Skills for Excel Professionals: Corporate Finance Institute
  • Power Pivot Fundamentals: Corporate Finance Institute
  • Conditional Formatting, Tables and Charts in Microsoft Excel: Coursera Project Network
  • Data Visualization and Dashboards with Excel and Cognos: IBM
  • Microsoft Excel with GenAI: Microsoft

Skills you can learn in Business Essentials

Analytics (37)
Presentation (33)
Modeling (29)
Business Analytics (27)
Language (26)
Microsoft Excel (26)
Writing (26)
Speech (18)
Plan (17)
Business Communication (16)
Decision-making (16)
Leadership (15)

Frequently Asked Questions about Pivot Table

Pivot Table courses on Coursera teach learners how to efficiently summarize and analyze data using pivot tables in various software platforms, including Microsoft Excel and Google Sheets. Skills covered include:

  • Basics of pivot table creation and customization.
  • Advanced techniques for data sorting, grouping, and filtering within pivot tables.
  • Methods for performing complex calculations and creating formulas within pivot tables.
  • Best practices for data visualization using pivot charts and conditional formatting.
  • Integration of pivot tables with other data analysis tools and techniques.
  • Strategies for using pivot tables to support decision-making in business contexts. ‎

Coursera’s Pivot Table courses are designed to accommodate learners with varying levels of experience:

  • Beginners: No prior experience with data analysis or pivot tables is necessary. Introductory courses provide a foundation in basic data manipulation and summarization.
  • Intermediate Learners: Those familiar with basic data operations can enhance their skills with more detailed pivot table functionalities and analysis techniques.
  • Advanced Professionals: Experienced data analysts can find courses that focus on integrating pivot tables with other advanced data analysis methods and software. ‎

Engaging with Pivot Table courses on Coursera can lead to various credentials that can substantiate your analytical skills:

  • Course Certificates: Earn a certificate for each Pivot Table course you complete, demonstrating your proficiency in specific aspects of data analysis.
  • Professional Certificates: These certificates consolidate your expertise in data analysis, highlighting your ability to handle complex data sets and provide actionable insights.
  • Specializations: A series of courses that provide in-depth training in advanced data analysis techniques, including extensive use of pivot tables, culminating in a hands-on project.‎

Mastering pivot tables can enhance your qualifications for a variety of roles that require data analysis, including:

  • Data Analyst: Using pivot tables to summarize large datasets and provide insights.
  • Financial Analyst: Applying pivot tables in financial forecasting and budgeting.
  • Market Research Analyst: Utilizing pivot tables to analyze market trends and consumer behavior.
  • Operations Manager: Implementing pivot tables to optimize and streamline business operations.
  • Administrative Support: Employing pivot tables to manage and report on internal data effectively. ‎

Looking to enhance your team's Pivot Tables skills? Coursera provides tailored enterprise solutions for teams ranging of 5-125 employees. Our offerings include advanced analytics, customized learning paths, and collaborative tools. To explore our Pivot Tables training options and make a purchase, please visit our Coursera for Teams page.‎

This FAQ content has been made available for informational purposes only. Learners are advised to conduct additional research to ensure that courses and other credentials pursued meet their personal, professional, and financial goals.

Other topics to explore

Arts and Humanities
338 courses
Business
1095 courses
Computer Science
668 courses
Data Science
425 courses
Information Technology
145 courses
Health
471 courses
Math and Logic
70 courses
Personal Development
137 courses
Physical Science and Engineering
413 courses
Social Sciences
401 courses
Language Learning
150 courses

Coursera Footer

Skills

  • Artificial Intelligence (AI)
  • Cybersecurity
  • Data Analytics
  • Digital Marketing
  • English Speaking
  • Generative AI (GenAI)
  • Microsoft Excel
  • Microsoft Power BI
  • Project Management
  • Python

Certificates & Programs

  • Google Cybersecurity Certificate
  • Google Data Analytics Certificate
  • Google IT Support Certificate
  • Google Project Management Certificate
  • Google UX Design Certificate
  • IBM Data Analyst Certificate
  • IBM Data Science Certificate
  • Machine Learning Certificate
  • Microsoft Power BI Data Analyst Certificate
  • UI / UX Design Certificate

Industries & Careers

  • Business
  • Computer Science
  • Data Science
  • Education & Teaching
  • Engineering
  • Finance
  • Healthcare
  • Human Resources (HR)
  • Information Technology (IT)
  • Marketing

Career Resources

  • Career Aptitude Test
  • Examples of Strengths and Weaknesses for Job Interviews
  • High-Income Skills to Learn
  • How Does Cryptocurrency Work?
  • How to Highlight Duplicates in Google Sheets
  • How to Learn Artificial Intelligence
  • Popular Cybersecurity Certifications
  • Preparing for the PMP Certification
  • Signs You Will Get the Job After an Interview
  • What Is Artificial Intelligence?

Coursera

  • About
  • What We Offer
  • Leadership
  • Careers
  • Catalog
  • Coursera Plus
  • Professional Certificates
  • MasterTrack® Certificates
  • Degrees
  • For Enterprise
  • For Government
  • For Campus
  • Become a Partner
  • Social Impact
  • Free Courses
  • Share your Coursera learning story

Community

  • Learners
  • Partners
  • Beta Testers
  • Blog
  • The Coursera Podcast
  • Tech Blog

More

  • Press
  • Investors
  • Terms
  • Privacy
  • Help
  • Accessibility
  • Contact
  • Articles
  • Directory
  • Affiliates
  • Modern Slavery Statement
  • Manage Cookie Preferences
Learn Anywhere
Download on the App Store
Get it on Google Play
Logo of Certified B Corporation
© 2025 Coursera Inc. All rights reserved.
  • Coursera Facebook
  • Coursera Linkedin
  • Coursera Twitter
  • Coursera YouTube
  • Coursera Instagram
  • Coursera TikTok